Resource monitoring
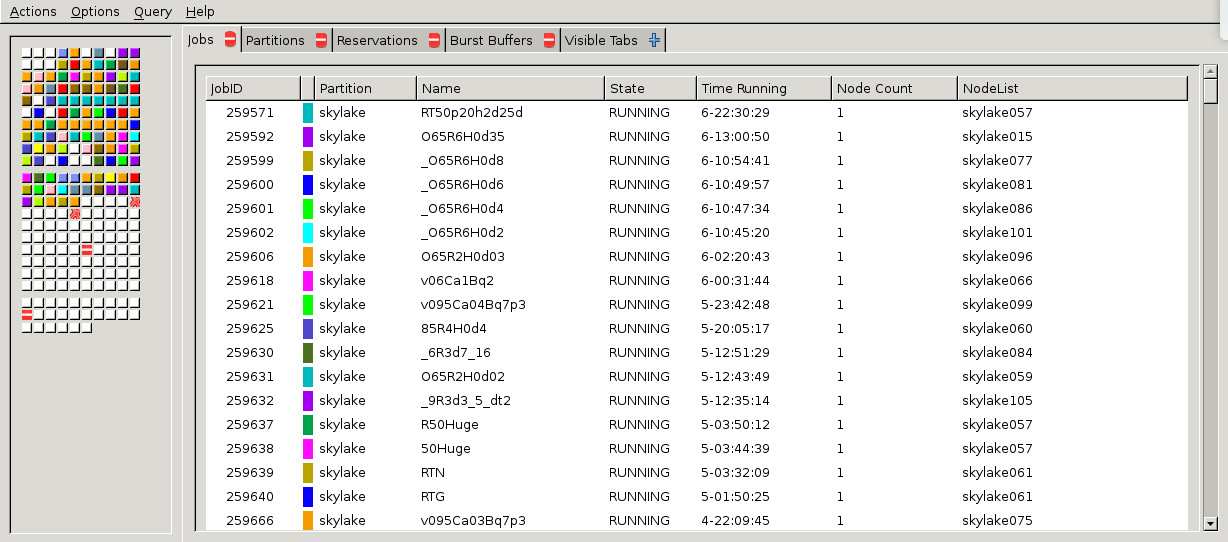
You can monitor the current status of cluster resources using an application with graphical user interface called sview. The tabs can be configured with a right mouse click.
To use this application make sure that you have a running X server and X forwarding enabled in your ssh client session (ssh -X for example).

Project monitoring
Despite being a member of several projects a user can have only one user account.
The commands rheticus_info, rheticus_jobs and rheticus_accounting can be used to display the information about user’s jobs and projects. To display a help message or the possible options, you can use -h option with all these commands above.
[mazadi@login02]$ rheticus_info

Recent jobs:
[2018-11-09 13:10:14] 262288 'RT50p20h2d25d' b032/skylake (01:43:52)
[2018-11-09 10:36:29] 262257 'RS100RT15' b031/skylake (04:17:37)
[2018-11-09 10:33:52] 262255 'S100XRTA005' b073/skylake (04:20:14)
[2018-11-09 10:30:33] 262254 'Osc30X2d' b002/skylake (17:34:12)
[2018-11-09 10:12:16] 262250 'RTL' b073/skylake (1-04:11:00)

Relevant projects:
b002: 44295 hours have been consumed (Used 35.4% of 125021 hours)
b031: 69781 hours have been consumed (Used 95.2% of 73335 hours)
b032: 39815 hours have been consumed (Used 71.5% of 55723 hours)
b073: 43710 hours have been consumed (Used 72.6% of 60185 hours)
h111: 12085 hours have been consumed (Used 60.4% of 20000 hours)
Also, the project leaders can monitor resource consumption and perform project related actions on this web page.
Statistics
On this page you can see the resource usage as function of time (CPU hours / CPU per month / CPU per year).
Some statistical data about jobs’ waiting time: